


Placement Performance of Electronics & Communication, Mechanical and Information Technology Departments (2021 to 2024) |
|||||||||
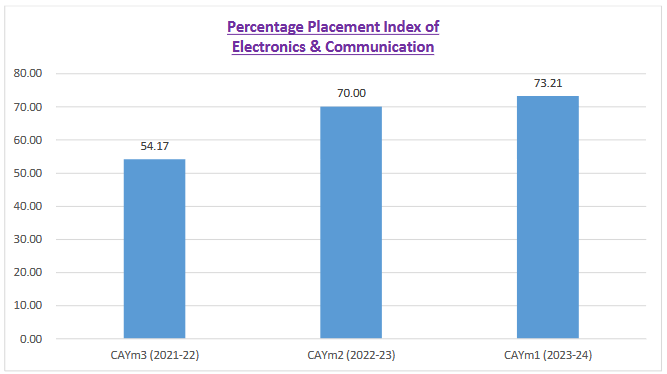
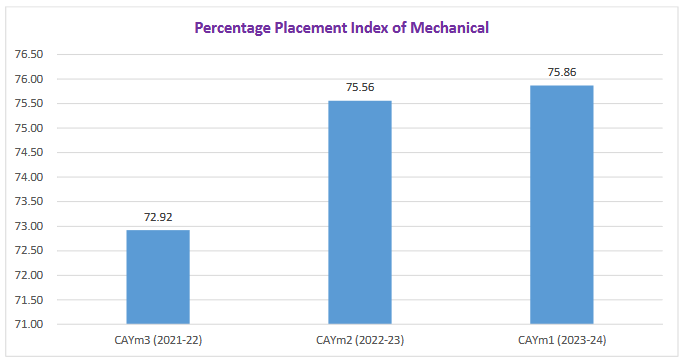
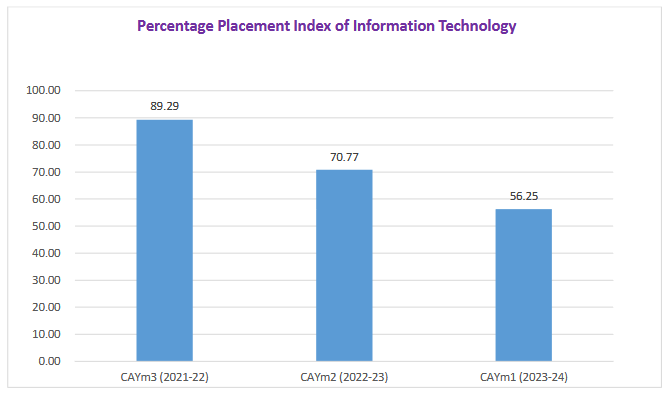
| Item | CAYm1 (2023-24) | CAYm2 (2022-23) | CAYm3 (2021-22) | ||||||
| Branch | EC | Mech | IT | EC | Mech | IT | EC | Mech | IT |
| Total number of Final year students (N) | 56 | 58 | 64 | 10 | 45 | 65 | 24 | 48 | 56 |
| Number of students placed in companies or Government sector (x) | 38 | 44 | 34 | 6 | 31 | 43 | 13 | 33 | 48 |
| Number of students admitted to higher studies with valid qualifying score (GATE or equivalent State or National level tests, GRE, GMAT etc.) (y) | 3 | .. | 1 | 1 | 2 | 2 | .. | 2 | 1 |
| Number of students turned entrepreneur in engineering / technology (z) | .. | .. | 1 | .. | 1 | 1 | .. | .. | 1 |
| Grand Total x + y + z | 41 | 44 | 36 | 7 | 34 | 46 | 13 | 35 | 50 |
| Placement Index (x+y+z)/N | 0.73 | 0.76 | 0.56 | 0.70 | 0.76 | 0.71 | 0.54 | 0.73 | 0.89 |
| Percentage Placement Index | 73.21 | 75.86 | 56.25 | 70.00 | 75.56 | 70.77 | 54.17 | 72.92 | 89.29 |
 |
 |
 |

| Department | Placement Records |
| 1. Electronics & Communication Engineering | View file |
| 2. Mechanical Engineering | View file |
| 3. Information Technology | View file |